


Next: How to use it?
Up: DiaGraph
Previous: What's DiaGraph?
Let me give you an idea about the language with the following simple example
corresponding to the Figure below.
The basic idea is just to describe the way how pieces, such as lines,
arrows and boxes, are connected to one another to form a block diagram.
R(1)
c("$ r $")
p
a(label-1)
R(1)
b(2,1,"$ G $")
c("stable")
r(1)
k(label-2)
R(1)
c("$ y $")
g(label-2)
d(1.5)
l(label-1)
U(label-1)
m
Each piece has a starting point and an ending point; for example, the
starting point and ending point of an arrow are its tail and head,
respectively. Unless otherwise specified, the starting point of a piece
will automatically be placed at the ending point of the previous piece.
In other words, when a piece is drawn, the current position will
be moved to its ending point, and the next piece will be drawn from the
current position. On the other hand, a few commands act on another
position that also moves automatically with the placement of each piece,
which we call the subcurrent position.
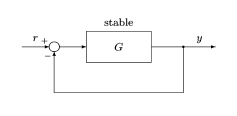
Figure: A simple block diagram
As you could guess from the example,
-
Only one command should be described in a line. A command should
be written in one line. A blank line is allowed.
The last command in a source file should be followed by
a new line.
-
R(1) means a right arrow of length 1.
r(1) means a line of length 1 ``to the right'' (by which
its starting point and ending point would be clear).
Similarly, L and l mean left, U and u up,
D and d down. When one of these commands is issued, the
current direction will be set to its direction.
At the same time, the subcurrent position will be set at the middle
of the arrow/ line with the shift by the value of the parameter
\c ``to the left with respect to the current
direction.'' (See Section 4 for the parameter.)
-
b(2,1,"*") draws a box of width 2 and height 1 with the
string * centered in it, toward the current direction.
The current position will be moved to the middle of the
``forward edge'' of the box.
Also, the subcurrent position will be set at the middle of the
``left-side edge with respect to the current direction'' plus
the same shift as the above. (If the value of \c
is negative, its ``mirror image.'')
-
a means a summing junction, which must be always given a label.
It has its starting and ending points at its center; the current
position remains unchanged. The subcurrent position will be moved to
the left of the center with respect to the current direction, with
the distance of \c.
-
k draws a forking junction (a disk with a tiny radius),
which must be also labeled.
-
g means jump to a label; it moves the current position to
the point of the label. Also, the subcurrent position will be
moved to the point with the same shift as described for a.
-
p and m are respectively for plus and minus signs
beside summing junctions. The current/ subcurrent positions
remain unchanged.
-
c("*") draws the string * ``at the subcurrent position'';
the actual action depends on the current direction.
If it is `right(left),' the bottom(top)-center of the string will be
placed at the subcurrent position. If it is `up(down),' the
right(left)-center will be placed at the subcurrent position.
(If the value of \c is negative, exchange
top and bottom, and up and down in the above.) These rules might
look very complicated at a glance, but you will find them quite
reasonable and simple actually.
Line/ arrow drawing commands such as l and U can take
a label (rather than a number indicating the length) as their argument,
in which case the line/ arrow will be drawn up to the nearest point
to the label (i.e., the point with the same x or y coordinate as
the point of the label) along the direction.
Other features are listed below.
-
R! and r! are the same as R and r,
respectively, except that a dashed arrow/ line is drawn.
Similarly for other directions.
-
B is similar to b, but draws a dashed box.
-
s(1) draws a sampler, which looks like a switch,
of ``length'' 1 towards the current direction.
s() draws a sampler of a default length.
-
n is similar to a and k, but draws nothing;
it just gives the current position a label for later use.
-
t(r) changes the current direction into `right.' l,
u and d are the other possible arguments.
-
x(1) moves the current position to the right by 1.
x(label) moves it horizontally so that it has the same
x coordinate as the point of the label.
y(1) moves the current position upwards by 1.
y(label) moves it vertically so that it has the same
y coordinate as the point of the label.
X and Y are for the subcurrent position.
These commands draw nothing.
-
A command line that begins with %% is a comment, which will
be copied to the output LaTeX file after deleting the first %.
(Using this feature, you can embed a LaTeX command to the output
file, by placing only a single % before it in the source file.
This enables you to draw a block diagram that cannot be drawn only
with the built-in functions provided by DiaGraph,
e.g. that
with an oblique line.)
On the other hand, a line that begins with \%
will be regarded as a comment that should not be copied to the
output file.
%% after a command means an in-line comment.
The text following it will be regarded as a comment, which
will not be copied to the output LaTeX file.
-
After having declared $lengthlabel=2, you can write
for example R($lengthlabel) instead of R(2).
You can also write something like x(-$lengthlabel);
it is valid even if the value of $lengthlabel is negative.
This might be useful when you are to adjust the sizes of similar
pieces at one time. This kind of labels are called
length labels or numerical labels, while the labels
indicating positions are called coordinate labels.
Next: How to use it?
Up: DiaGraph
Previous: What's DiaGraph?
Tomomichi Hagiwara
Tue Jul 28 19:12:21 JST 1998
Site Policy